Overview
What a good spec sheet includes
Origin info
- • Country
- • Region
- • Producer/station
- • Elevation
- • Variety
Processing
- • Process method
- • Fermentation details
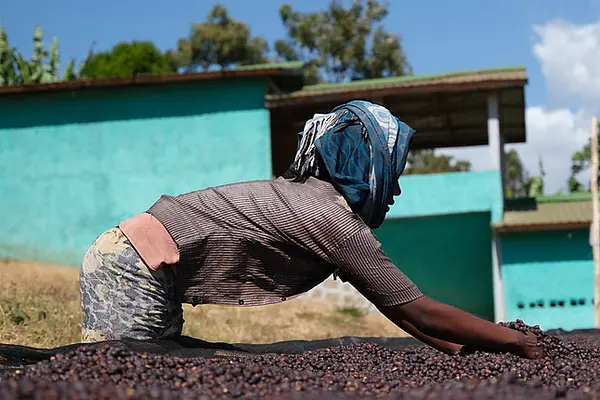
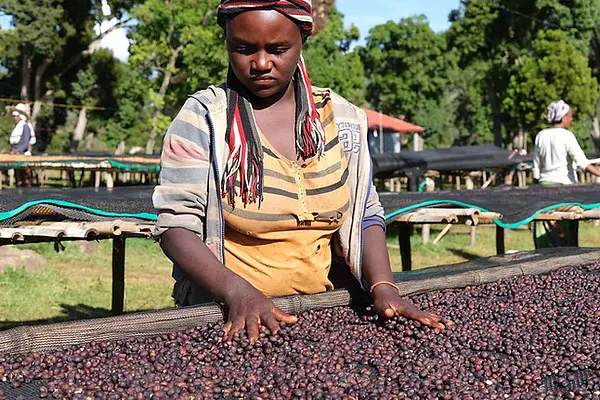
- • Drying method
- • Crop year
- • Harvest dates
Quality specs
- • Moisture %
- • Water activity (aW)
- • Density (g/L)
- • Screen size
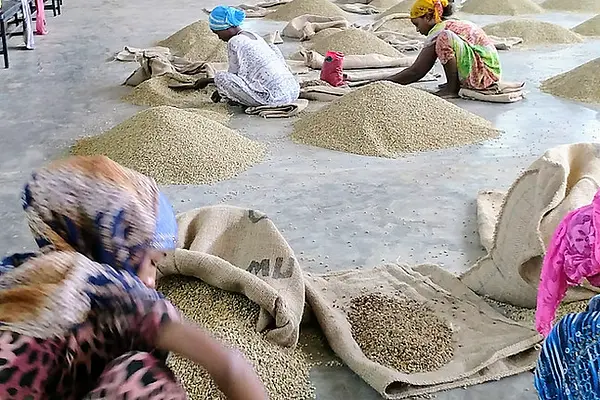
- • Defect count
Cupping
- • Cupping score
- • Flavor notes
- • Acidity descriptor
- • Body descriptor
- • Cupper/Q-grader
Spec #1
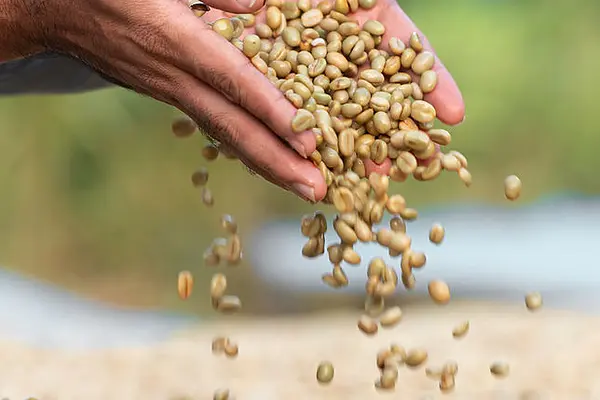
Moisture content (%)
Moisture tells you how much water is in the bean. It affects roast behavior, storage stability, and whether you're paying for water weight.
Reading moisture
Spec #2
Water activity (aW)
Water activity measures how "available" the moisture is for microbial growth. It's a better predictor of shelf stability than moisture content alone.
Reading water activity
Specs #3 & #4
Density and screen size
Density (g/L)
Higher density often correlates with higher elevation, slower maturation, and more complex cup. Denser beans absorb heat differently.
- • 600–650 g/L: Lower density. Often lower elevation.
- • 650–700 g/L: Medium density. Common range.
- • 700–750+ g/L: High density. Often high elevation, complex cup.
Screen size
Screen size measures bean dimensions. Larger screens (17/18) are often premium-priced. But size ≠ quality—it's about uniformity for even roasting.
- • Screen 13–14: Smaller. Common in some origins.
- • Screen 15–16: Medium. Most specialty falls here.
- • Screen 17–18+: Large. "Supremo" or "AA" grades.
Roast implication: Uniform screen size = even heat absorption = consistent development. Mixed sizes mean some beans are done before others.
Spec #5
Cupping score
The SCA cupping score is the most-cited quality number. It's useful for screening, but it's not the whole story.
Score ranges
What affects score
- • Fragrance/Aroma
- • Flavor
- • Aftertaste
- • Acidity
- • Body
- • Balance
- • Uniformity
- • Clean cup
- • Sweetness
Score caveats
- • Different cuppers score differently
- • Origin cupping ≠ arrival cupping
- • Light roast sample ≠ your roast
- • Score inflation is real
Examples
Coffees with full specs
Washed Sidama
Southern Nations, Nationalities, and Peoples' Region, Bensa
Floral | Lemongrass | Green Tea | Peach
Washed · In Stock
WUSH WUSH
Oromia, Hambela
Sangaria | Fruit Bomb | Floral | Sweet Finish
Natural, 120 hours dry Fermentation! · In Stock
Natural ARDI
Sidama, Damo
Clean Strawberry | Peach | Sweet Finish
Natural · In Stock
Harrar Gr 1
Oromia, Micheta
Chocolate | Barries | Carmel | Full Body
Natural · In Stock
Washed Guji
Oromia, Shakiso
Black Tea | Floral | Bergamot
Fully washed · In Stock
NATURAL SIDAMA GR 4
Sidama
Dark Chocolate | Nuts | Medium Acidity | Complex | Comforting
Natural · In Stock